Key takeaway (TL;DR)
Richard Saul Wurman, information architect and founder of TED, proposed the Five Hat Racks, also known as LATCH: however extensive or complex a collection becomes, its organizing dimensions can ultimately be reduced to Location, Alphabet, Time, Category and Hierarchy or Continuum. A corporate website or digital platform often becomes a maze not because it lacks content, but because it confuses the jobs of these five organizing methods. In corporate website development and platform redesign, JVDS advocates choosing primary and secondary structures around how users actually look for information, turning an exhaustive search into a direct, intuitive route.
1. Five organizing shelves for an information explosion: the LATCH framework
Faced with thousands of product SKUs, millions of industrial drawings or decades of corporate records, inexperienced teams often invent an obscure classification scheme. Their information platform eventually becomes a Tower of Babel.
In Information Anxiety, Wurman emphasizes that the organization of information determines the meaning readers can draw from it. The information itself has not changed; the framework through which we examine it has.
1.1 How the five LATCH dimensions correspond to users' mental models
- L — Location: organization by physical geography or relative coordinates in a virtual space.
- Underlying question: Where is it? What is near me? How is it distributed? Examples include maps of global branches, emergency evacuation plans and asset-location systems for smart campuses.
- A — Alphabet: indexing by a standard character sequence, such as pinyin initials or the Latin alphabet from A to Z.
- Underlying question: If I already know the name, how can I find it reliably as I would in a dictionary? Examples include technical glossaries and staff directories indexed by name.
- T — Time: organization by absolute chronological sequence or relative historical order.
- Underlying question: When did it happen? How did it develop? Examples include brand milestones, news feeds and system audit trails.
- C — Category: grouping by essential characteristics, functions or application contexts.
- Underlying question: What kind of thing is it? What comparable alternatives exist? Examples include electronics, homeware and clothing categories in ecommerce, or university subject areas.
- H — Hierarchy or Continuum: a linear ordering by numerical value, priority, rating or price.
- Underlying question: Which is tallest, most expensive or most relevant? Examples include sales rankings, search results ordered by relevance and product filtering by net weight.
2. One collection of landmark towers, five different stories
To understand the power of LATCH, imagine a database of one hundred landmark towers, including the Empire State Building, Eiffel Tower, Jin Mao Tower, Burj Khalifa and Oriental Pearl Tower:
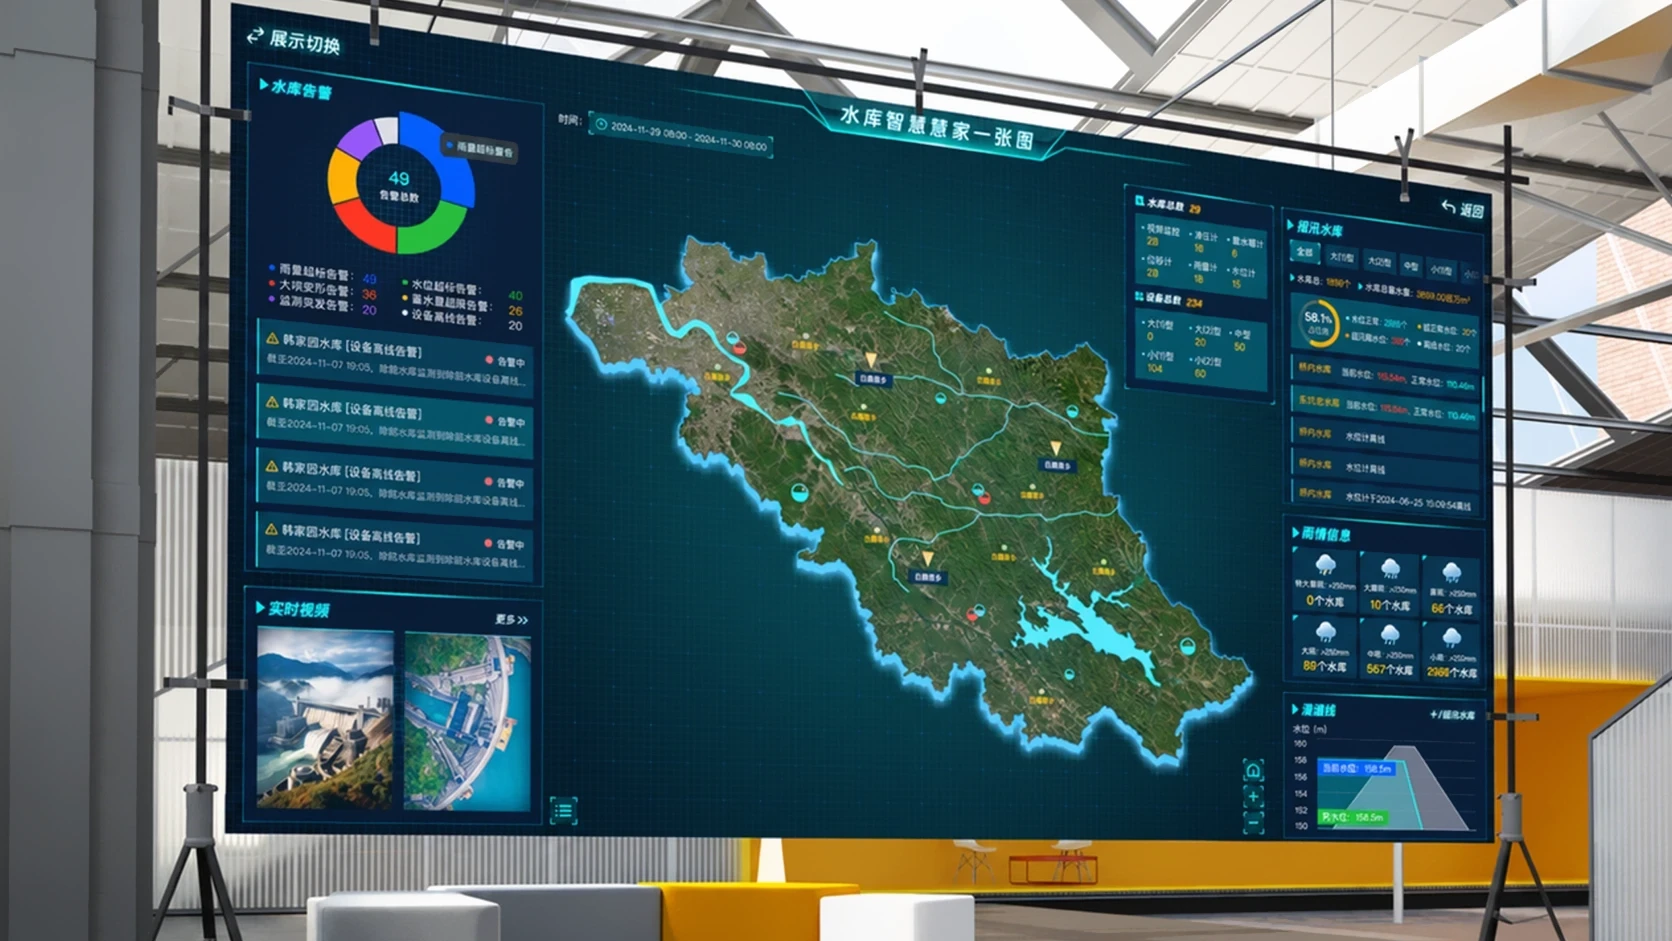
- Organized by L, Location: place markers on an interactive three-dimensional globe. Viewers see the rise of regional economies and shifts in the geographic center of architectural development.
- Organized by A, Alphabet: create an A–Z directory from Burj Khalifa to Taipei 101. Viewers can check a particular building's specifications within three seconds.
- Organized by T, Time: draw a timeline from 1889 to the present. Viewers discover the historical development of steel manufacturing, elevator technology and structural calculation.
- Organized by C, Category: separate broadcasting towers, high-rise commercial complexes and classical commemorative towers or arches. Viewers understand the different functions people expect tall structures to perform.
- Organized by H, Hierarchy: arrange the structures from 828 meters down to 100 meters. Viewers immediately experience the visual impact of absolute height and ranking.
The underlying information is entirely unchanged, yet these five structures give the data five distinct commercial and communicative meanings.

3. Comparing the five organizing dimensions
When building commercial websites and software platforms, product and development teams need to select an organizing framework that matches the user's search journey:
| Organizing dimension | Best-matched user task or intent | Typical interaction and layout | Critical mistake to avoid |
|---|---|---|---|
| Category Broadly applicable and mentally accessible | The user has a broad need and wants to narrow the options through browsing. | A mega menu in the main navigation or a hierarchical category tree in the sidebar. | Organizing an external customer-facing site around obscure internal reporting departments. |
| Hierarchy Supports comparative decisions | The user has a clear goal and wants to compare prices, choose the best option or inspect a ranking. | Sortable table columns and range sliders for price filtering. | Ranking unquantified subjective qualities such as attractiveness, undermining credibility. |
| Time A thread for chronological narratives | The user wants to understand developments, investigate historical issues or follow current progress. | Vertical or horizontal timelines, Gantt charts and version-comparison drawers. | Turning important solution content into a fragmented reverse-chronological feed simply because publication dates are available. |
| Location Connects information with geography | The task concerns physical branches, regional market coverage or spatial navigation. | Interactive Mapbox or Amap drill-down maps, or linked region, province and branch selectors. | Adding a static map with no useful interaction to every content type and slowing down loading. |
| Alphabet A reliable route for precise lookup | The collection contains many specialist terms, and the user already knows the full name and spelling of the target. | A floating A–Z index or dictionary-style glossary. | Forcing users to guess a product name or pinyin spelling when they only know the problem they need to solve. |
4. The JVDS approach: one primary structure with independent supporting dimensions
For large asset-management platforms and multinational corporate portals, JVDS proposes an information architecture built on one primary dimension and dynamically combined, independent secondary dimensions:
[JVDS Orthogonal Information Architecture Matrix]
Identify the core search intent → Establish the primary organizing axis → Add independent secondary filters → Stress-test navigation for blind spots
- Primary Axis + Orthogonal Filters: JVDS opposes mixing all five dimensions indiscriminately on one page. Establish one main structural axis. For example, use C, industry category, as the first-level view in a case-study library. Once a category is selected, provide filter chips for T, year, L, region, and H, project budget. A complex collection then becomes an understandable grid of intersecting dimensions.
- Self-Explaining Sort Protocol: when users change the quantitative sorting criterion, the main data badge on each result card must change with it and explain the ordering. Sorting by delivery time should highlight a badge such as “Delivery time: 18 days.” Switching to team satisfaction should change it to “Positive rating: 99.2%.” This closes the gap between seeing a sorted list and understanding why a particular result comes first.
- Zero-Result Soft Fallback: combined filters can become so restrictive that no results remain. JVDS system guidelines require more than a blank “No data” illustration: relax the most restrictive dimension and explain the fallback constructively. For example: “No cases matched South China + 2026 + Healthcare. We have expanded the results to relevant cases nationwide.”

5. Frequently asked questions
Q1: Is a timeline the best choice for a corporate About Us or company-history page?
Yes, but it should not become a diary of minor events. A timeline filled with staff sports days and official visits offers little commercial value to prospective customers. A strong time-based structure is milestone-driven: select five to seven genuinely significant turning points involving technical breakthroughs, international qualifications or major strategic financing. Use years as the backbone and support the story with substantiated growth indicators. That is how a timeline can strengthen the brand.
Q2: Is LATCH sufficient for an ecommerce catalog or asset library with more than fifty attributes?
Yes. Those attributes are subdivisions of the five LATCH dimensions. Screen size, memory, battery capacity and price belong to H, quantitative continuum. Brand, target audience and operating system belong to C, category. Place of manufacture and shipping origin belong to L, location. Sorting fifty scattered attributes into these underlying groups can bring immediate order to a cluttered filter panel.
Q3: How can we measure whether a large website's classification actually feels intuitive?
Use card sorting and reverse navigation-tree testing, often known as Treejack testing. Put one hundred core pages on cards and invite thirty representative customers to group them freely, without predefined categories, in an open card-sorting exercise. Then ask them to find specified content in a plain-text navigation tree with no visual distractions. If more than 85% reach the destination within three clicks along the same route, with almost no backtracking, the architecture meets a world-class industrial standard. Explore JVDS design work for information-architecture examples combining large-scale information handling with a simple, intuitive experience.