Key Takeaway (TL;DR)
The signal-to-noise ratio, or SNR, is a central measure of communication clarity in information architecture and data visualization. Within an audience's limited attention, useful data that directly supports decisions is the signal. Irrelevant decoration, elaborate textures, heavy grids, and redundant elements are noise that consumes cognitive capacity. JVDS emphasizes that improving SNR does not mean indiscriminately removing necessary business fields. It means applying Edward Tufte's data-ink ratio: eliminate visual clutter while rigorously preserving units, baselines, and causal context.
1. The Entropy Trap in Information Design: Recognizing Chart Noise
In business reports and enterprise dashboards, design teams often assume that more elements look more professional, pushing the system toward cognitive overload:
A Progressive Model for Refining Visual Signal-to-Noise Ratio
- Layer one: Strengthen the signal—highlight core indicators: Identify the values and states that support decisions, and make the first second of attention land on key business indicators.
- Layer two: Remove noise—strip decorative textures: Remove heavy gridlines, three-dimensional gradients, decorative shadows, and busy backgrounds to increase the data-ink ratio.
- Layer three: Anchor coordinates—retain units and baselines: Preserve true zero baselines, measurement units, and stated time periods so context remains complete.
- Layer four: Reach the decision—see trends in 0.1 seconds: Use minimal visual encoding to remove ambiguity and row-tracking confusion, helping users recognize system conditions and anomalies within milliseconds.
- The texture-noise experiment with cheese production: In a classic information-design example, a pie chart of U.S. cheese production by category in 1997 was filled with dots, diagonal stripes, and crosshatching. Viewers spent their cognitive resources processing the distracting textures. Replacing all decoration with clean grayscale sections and placing category names and percentages directly beside each segment preserved every piece of information while increasing decoding speed fourfold.
- Lightening the structure of a soybean-production table: An early five-row table of soybean production and harvested acreage used heavy black gridlines, dark headers, and decorative alternating fills. Non-data ink overwhelmed the figures. A modern solution removes vertical lines, reduces horizontal dividers to 1 px light gray, and uses strict left alignment for text and right alignment for numbers to establish natural column tracks. The most rigorous tables often let the lines disappear and the data speak.
- The deceptive truncation trap in an ice-cream bar chart: To create a supposedly neat appearance or exaggerate performance, some charts arbitrarily truncate the Y-axis baseline. A modest 5% change can then look like a tenfold increase. Although visually tidy, such distorted comparison creates a misleading false signal. High SNR must rest on honest, complete data.
2. Common High-Noise Interface Failures
Large digital displays, SaaS workspaces, and mobile applications often contain oppressive design failures because their signal-to-noise ratio is uncontrolled:
2.1 Showy Floating-Crystal Pseudo-3D
To satisfy certain executives' crude taste for futuristic technology, designers turn ordinary two-dimensional lines into 3D pipes and add reflections, top shadows, and mirrored floors to bars. The actual bar height becomes ambiguous: should viewers read the front or back edge of its top surface? Lighting effects steal attention, reducing the business metrics to a cheap backdrop.
2.2 Bold Everything and Add Every Color
Some enterprise systems give every field a colored background, put key indicators in oversized bold type with fluorescent yellow highlighting, and mark secondary figures with flashing red dots. When twenty elements simultaneously compete for attention, the interface becomes a field of unfocused white noise, rapidly exhausting the user.
3. A Four-Dimensional Signal-to-Noise Matrix for Data Design
To help teams reduce noise systematically in information layouts, we use this four-dimensional screening matrix:
| Evaluation dimension | High-value core signal | Necessary supporting context | Harmful, redundant noise to remove |
|---|---|---|---|
| Chart guides and grids | Retain only three or four very thin horizontal dashed reference lines, 1 px in #E5E7EB, to support visual alignment | Clearly label sampled time intervals along the X-axis | Use dense, heavy black crosshatching or elaborate diagonal geometric background meshes |
| Values and units | Provide hover tooltips that reveal complete values and exact physical units within milliseconds | State shared units in the table header or chart subtitle, such as “Unit: RMB 10,000” | Omit essential units, leaving dollars and yuan indistinguishable, or crowd labels at a 45° angle |
| Color channels and status | Use restrained graphite and dark gray for 90% of data, reserving one or two high-contrast semantic colors for important states | Use translucent dashed or pale secondary lines for historical comparisons | Give every bar a different rainbow color without any connection to business meaning |
| Container borders and shadows | Define card boundaries with 16–24 px of negative space for an open, contemporary appearance | Use very light 1 px borders or widely diffused ambient shadows in dense dashboards | Surround every card with heavy dark shadows or three layers of three-dimensional borders |
4. JVDS's Engineering Practice of Maximizing the Data-Ink Ratio
In high-precision financial terminals, smart-energy hubs, and modern UI/UX design, JVDS treats signal-to-noise refinement as a core principle of engineering-grade interfaces:
- The Strip-Down Method: Our senior design leads apply a rigorous reverse-subtraction test to every dashboard. We try removing each line, shadow, and icon background in turn. If decision accuracy and speed do not decline at all, that element is pure visual waste and must be permanently removed. Every remaining pixel must carry an irreplaceable decision-making purpose.
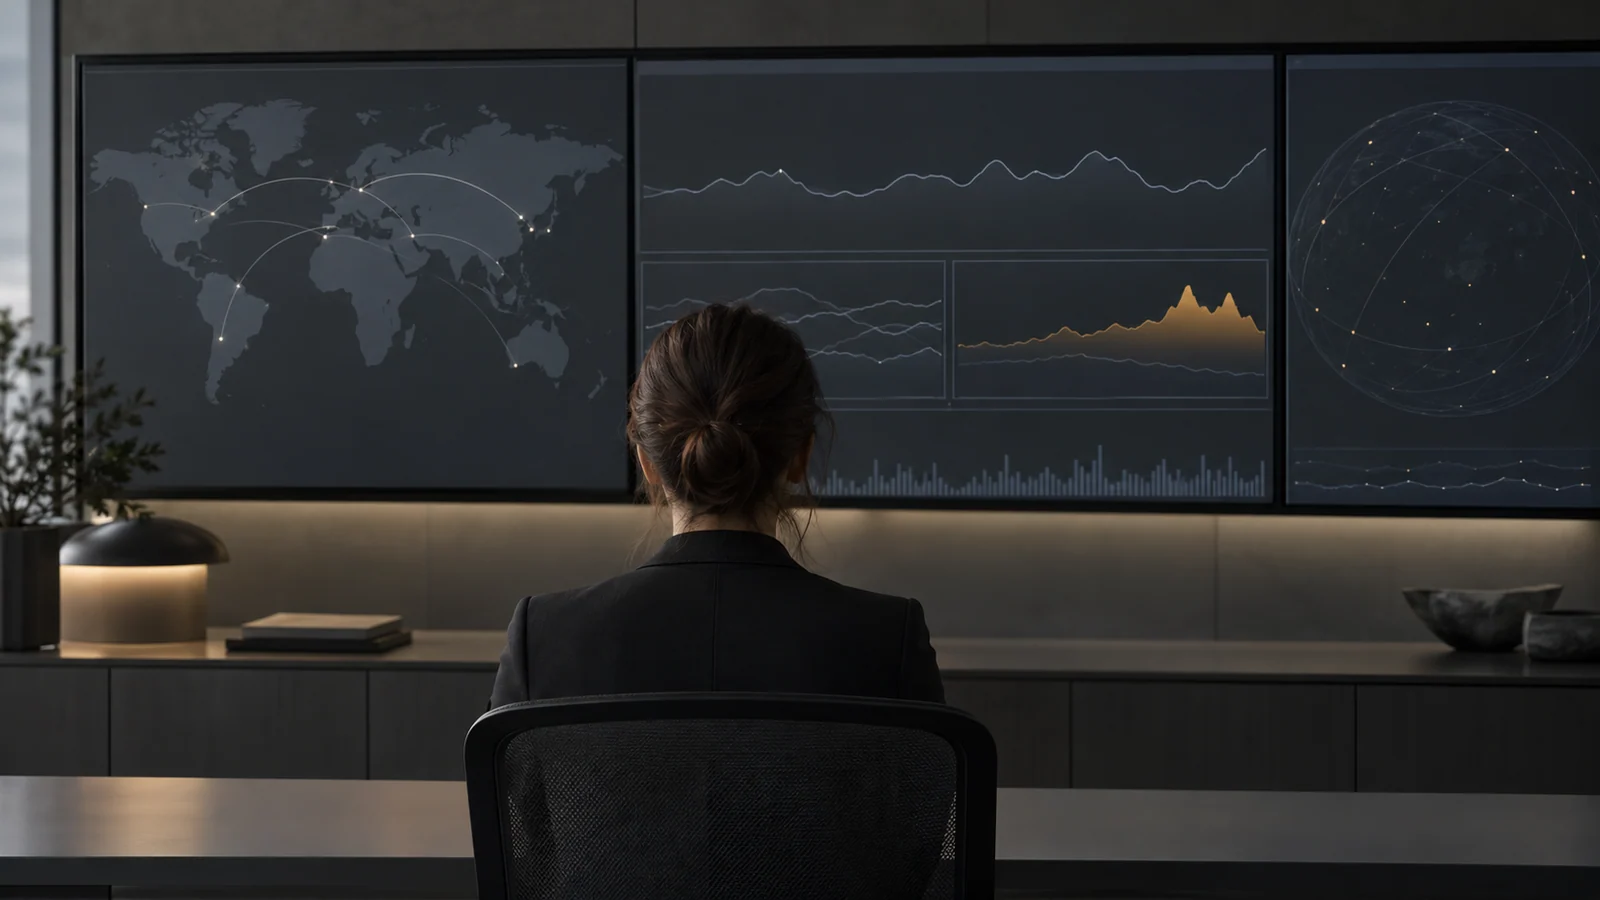
- Low-noise architecture through Micro-Glow Guidance: In dense data displays, JVDS rejects harsh light pollution. We calibrate the underlying interface to a low-saturation, light-absorbing dark gray and keep normal rows quietly matte gray-white. Only when a threshold is exceeded or a failure risk emerges does a precise warning color illuminate like a small light in the deep sea. Extreme visual calm makes critical changes exceptionally visible. Explore our design portfolio for the clarity of industrial-grade high-SNR interfaces.
- The nonnegotiable rule of Lossless Information Integrity: Noise reduction must never sacrifice context. We do not arbitrarily truncate important long text to make a layout attractive, nor omit statistical definitions or time cutoffs. Restrained interactions such as intelligent overlays and miniature sparklines preserve a clear view while keeping the complete evidence chain available at a touch.
5. Frequently Asked Questions (FAQ)
Q1: Should alternating zebra stripes be retained in data tables?
It depends on the number of columns and the horizontal span. In a compact table of three or four columns, striping is redundant noise; a 1 px light-gray divider is sufficient. In a financial table with more than twenty columns spanning 2,560 pixels, however, viewers can easily lose their row. Here, very subtle striping—a 2–3% brightness difference between alternating gray-white rows—becomes valuable guidance that can substantially reduce extraocular muscle fatigue.
Q2: How can you explain SNR to government or enterprise clients who want flashy displays that look overwhelmingly high-tech?
Use fighter-aircraft head-up displays and civilian navigation as a professional comparison. Show an authentic J-20 cockpit-display interface: no spinning 3D spacecraft or multicolored neon, just extremely clean, sharp green orthogonal vector lines. Explain: “Genuinely advanced technology helps a decision-maker understand the situation in 0.01 seconds at a critical moment. A screen full of colorful moving effects resembles a low-end arcade and undermines the professional decision-making standards of a multibillion-yuan enterprise.”
Q3: Why do many data-visualization experts dismiss pie charts as poor charts?
Because the visual cortex is far less accurate at estimating two-dimensional areas and sector angles than one-dimensional lengths and heights. When a pie contains more than five similarly sized slices, such as 18% versus 22%, viewers cannot distinguish them reliably and must repeatedly jump between slices and the legend. The signal-to-noise ratio is low. JVDS's engineering standard is to replace pies with more than three categories with a descending horizontal bar chart, using length to make comparisons directly and improving reading efficiency tenfold.